|
User Help Documentation |
|
|
With StormVueNGX, the last flagship software for visualizing lightning activity on
the Internet utilizes cutting edge software technology and programming techniques for improved online user experience, far beyond anything the competition
can offer. Real-time lightning data presentation aside, some of the additional features include user controllable display modes, visually attractive
vector based graphics and a configurable close lightning alarm.
Most StormVue NGX usage scenarios will involve embedding it into a web page but this software can also run as a standalone
desktop application. For company internal or home network use, data files can be uploaded to and accessed directly via a network disk. This eliminates
the requirement for a web server and enables users to remotely monitor their lightning detection system - in real-time - in most types of network
environments. StormVue NGX is an Adobe Flash application. It obtains data from the Data Server inter-process
communication (IPC) add-on for NexStorm which runs under Windows. Data Server will continuously transmit updated lightning
information to the Internet or a network disk, enabling a fast 4 second update rate. With StormVue NGX you can actually watch
lightning online as it happens!
|
 |
|
|
Date and time. Shows your local date and time. |
|
|
|
Strikes per minute counter. A counter that shows how many strikes are detected per minute. This counter will display
different counts depending on which display mode is selected.. |
|
|
|
Lightning statistics information.
| StormTracker and LD-350 mode - Strike types |
| +CG |
Positive polarity cloud to ground strike |
| -CG |
Negative polarity cloud to ground strike |
| Β±IC |
Intra-cloud strike, any polarity |
| LD-250 mode - Quadrant distribution of lightning |
|
If StormVue NGX is configured for LD-250 then no discrimination analysis of strike types is performed. Instead a Quadrant
distribution table will be shown where the amount of lightning occuring in each of four sectors is displayed.
N-E is the north-east quadrant (001Β°-090Β°),S-E is south-east (091Β°-180Β°), S-W
is south-west (181Β°-270Β°) and N-W is north-west (271Β°-360Β°). |
| Expanded statistics |
| Percent |
The percentage of total detected strikes for a specific strike category (or quadrant in LD-250 mode) and the currently
selected time frame |
| Totals |
Shows how many strikes in each category (or quadrant) has been detected for the currently selected time frame |
| Trends |
Trend arrows indicate how the strike rate trend is changing over time. If the strike rate for a particular category is increasing
then the arrow will point upwards, if it is decreasing then downwards.
If there is no significant change in the strike rate then the arrow will point right.
In LD-250 mode there is only a single trend arrow representing all categories of strikes. |
| Change |
This is the trend change in numbers for the currently selected time frame. |
| The Strike Rate Graph visualizes the trend for the currently selected time frame. If strikes are
categorized there will be three trend lines, otherwise a single trend line is drawn. | |
|
|
|
Display mode is an indicator showing the currently selected mode. To change mode use the Declutter button. |
|
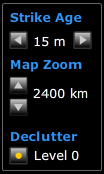 |
Map control panel allows you to change certain items relating to the map display.
Strike age controls how much old strike data is shown. The available range is 5 to 60 minutes. Default setting is 15 minutes.
Map zoom lets you zoom in and out on the map. You can also use the mouse scroll wheel to zoom. The available zoom levels and the
unit of distance measurement (kilometers or miles) will depend on how the web site owner has configured his StormVue NGX system.
Declutter button cycles through different display modes. The currently selected mode is reflected in the Display mode indicator.
| Declutter display modes |
| 0. Unfiltered |
All strikes are shown |
| 1. Clusters |
Only strikes that are determined to be part of a well defined storm cell are shown |
| 2. Cloud-ground |
Only cloud to ground strikes are shown |
| 3. C-G Clusters |
Only cloud to ground strikes that are determined to be part of a well defined storm cell are shown |
| 4. Density |
Shows densities of strike detections. For color mapping refer to the legend. Due to grid resolution variations the density fields may
appear slightly different in the respective map zoom levels. |
| 5. Storm Cells |
Only well defined storm cells are shown. If a new lightning strike related to a specific storm cell is detected, the storm cell
on the map will alert you of this by briefly flashing a lightning bolt or similar animation. |
|
Declutter modes 2 and 3 are not available if StormVue NGX is configured to run
in LD-250 mode. Declutter mode 5 is only available with real-time data and will not work during replay of past activity. | |
|
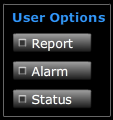 |
User options panel contains three buttons that will open certain windows when clicked.
Report window contains the current TRAC report which is generated by NexStorm. This is a text only report containing detailed
statistics about each thunderstorm that is currently being tracked.
Alarm window enables you to set up your own criteria based alarm
Status window displays information about the data feeding system and date and time (local time) of last data update. |
|
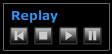 |
Replay control enables you to replay the last 60 minutes of lightning data. Replay is not available in Declutter mode 5 - Storm Cells. |
|
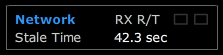 |
Network panel displays the status of network communications between StormVue NGX and the server hosting the data.
RX R/T consists of two indicators. The first indicator will flash briefly in blue color when StormVue NGX attempts to read data from the server. If there is an error the second indicator will indicate
this by turning red for approximately a second. Occasional errors are normal but frequent errors could indicate a problem on the server or with your Internet connection
Stale time shows the time in seconds since the last data update. The amount of staleness will depend on how the web site operator has configured his StormVue NGX data feed. If the feed is
continous real-time then Stale time will seldom be more than 10 seconds. If Stale time exceeds 300 seconds (5 minutes) this indicator will instead show "OFFLINE", indicating that there is no ongoing data feed. |
|
|
|
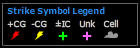
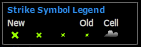
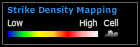
Strike Symbol Legend and Strike Density Mapping panels are there to help you interpret the information displayed on the map. Different legends will be
shown depending on which display mode the user has selected and which mode of operation StormVue NGX is configured for.
In StormTracker and LD-350 mode, CG is an abbreviation for Cloud to ground strike while IC means Intracloud strike. The sign prefix denotes strike polarities. "Unk" are strikes of unknown type.
In LD-250 display mode the symbol legend illustrates how the strike symbol size varies with time, from new strikes to old.
If Density display mode is selected (Declutter lever 4) then a color bar representing the varying density colors ranging from low to high will be shown instead. |
|